
Linux, Solaris and FreeBSD iostat monitoring with Cacti
Updated:
Note : This page may contain outdated information and/or broken links; some of the formatting may be mangled due to the many different code-bases this site has been through in over 25 years; my opinions may have changed etc. etc.
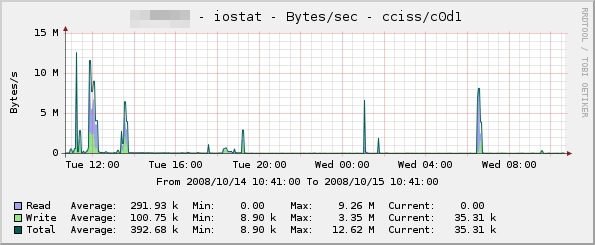
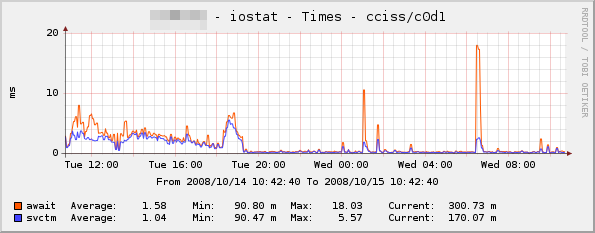
I’ve been looking for ages for a tool to parse the output from "iostat" on Linux, and graph it in Cacti. I found a few scripts and templates that did some of what I was looking for (disk I/O etc.), but nothing that gave me the full set of statistics such as queue length, utilisation, service time etc. I finally got round to writing my own set of templates and a data gathering script to provide this information, and it seems to work very well. So that others can benefit, I’ve posted the package archive and a brief description over on the Cacti forums (click Continue Reading for a download link to an updated version - the one on the Cacti forums has a bug so that it won’t work with all versions of sysstat). Below are a couple of sample graphs to give you an idea of what it can do - there’s also a few more samples posted in the Cacti forums thread :
Installation is a simple matter of creating a cron job to gather iostat data, extending your snmpd.conf to call the included iostat.pl script, and then importing the templates. Full instructions are included in the README within the archive (click the Continue Reading link to see them), but if you have any comments, suggestions or problems please let me know!
Update : Thanks to a patch from Viktor Sokolov, the iostat.pl script should now work with older sysstat versions, including the one that shipped with Debian Etch. I tried to update my original post over on the Cacti forums, but kept getting hit with a wonderful error message ("Mistake! Your message is sent to hell. Try still times who knows - can it will turn out?")
Update 2 : The package now supports Solaris.
Update 3 : The package now supports FreeBSD! The trinity is complete 
Update 4 : If you have trouble with the script (it returns no data in Cacti, graphs remain blank), try increasing the SNMP timeout setting for the device in Cacti. Some people have reported increasing this from 500ms to 10000ms works…
Update 5 : There is now a much improved persistent version of the script included - see below for comments from "acq"
Update 6 : The package is now being maintained at GitHub. This means you can now grab the latest version by running
git clone https://github.com/markround/Cacti-iostat-templates.git
Hopefully, this will mean that I’ll be able to incorporate patches more easily, as well as open up development to anyone who wants to fork their own versions. You can also download the latest tarball or ZIP archive from https://github.com/markround/Cacti-iostat-templates.
In the meantime, you can grab the old tarball here if you don’t have git installed.: cacti-iostat-1.6.tar.gz
Below is the full text from the included README :
OVERVIEW
--------
This is a collection of scripts and Cacti templates to graph the output from
the "iostat" command. At the moment, it supports Linux and Solaris iostat.
This release was put together by myself (Mark Round), and the iostat.pl script
was based heavily on the fantastic bind9 stats Cacti plugin, written by Cory
Powers. The iostat command used on Linux is "iostat -xkd", which requires a 2.5
or newer kernel. Solaris uses "iostat -dx" which should work on just about any
version of Solaris.
The Solaris modifications were made by Marwan Shaher and Eric Schoeller - many
thanks to you two
The Linux templates have all been exported from Cacti 0.8.7b, and the Solaris
templates were exported from Cacti 0.8.7d. Importing into newer versions of
Cacti should work, but importing into previous versions of Cacti will probably
not work - if you have problems with the templates, please try upgrading first
before reporting a bug.
The OID used by this script (.1.3.6.1.3.1) is marked as being reserved for
"experimental" usage. While it will work out of the box, this range may not be
unique across your organisation. If you decide to change this, you will need to
adjust the instructions below to reflect this.
CHANGES
-------
18/07/2009 - Version 1.5 - Added FreeBSD distribution from Boogie Shafer
22/06/2009 - Version 1.4 - Added FreeBSD license
19/03/2009 - Version 1.3 - Added patch from Marwan Shaher and Eric Schoeller
to support Solaris
16/03/2009 - Version 1.2 - Changed instructions for cron job, so that commas
get substituted with period (.) characters on
older iostat versions
10/03/2009 - Version 1.1 - Added patch from Viktor Sokolov to work with older
sysstat found on Debian Etch and other distros.
14/10/2008 - Version 1.0 - Initial release
FREEBSD NOTES
-------------
Thanks to the awesome work of Boogie Shafer, there is now a FreeBSD port
of these scripts. I have included the modified tarball that was sent to me,
this is inside the archive as the following file :
cacti-iostat-1.x-boogie_freebsd_linux_changes.tar.gz
FreeBSD users should unpack this archive and follow the instructions inside.
I have not had time to go through and merge these changes into one unified
distribution yet, but as people were asking for the FreeBSD port, here it
is!
The next release of these scripts should see the scripts and templates
etc. merged in, much the same as the Solaris modifications by
Marwan Shaher and Eric Schoeller.
INSTALLATION
------------
1.) CRON JOB
On the server to be monitored, copy scripts/iostat.pl to /usr/local/bin.
Then, define a cron job that creates the iostat.cache file. For example, on
most Linux systems, you should be able to create a file called
/etc/cron.d/iostat with the following contents :
* * * * * root cd /tmp && iostat -xkd 30 2 | sed 's/,/\./g' > io.tmp && mv io.tmp iostat.cache
And on Solaris, you'll need to edit a suitable crontab (root or sys would be the
obvious choices) with the following :
* * * * * cd /tmp && iostat -dx 30 2 > io.tmp && mv io.tmp iostat.cache
This will create the cache file once every minute, and will sample for 30
seconds. You can adjust this figure as necessary, but avoid the trap of setting
it to sample for 60 seconds - as the command will take slightly longer than 1
minute to run, you'll end up with multiple processes running.
2.) SNMPD MODIFICATION
Edit your NET-SNMPD snmpd.conf file to include the following (adjusting the OID
if necessary, see above) :
pass .1.3.6.1.3.1 /usr/bin/perl /usr/local/bin/iostat.pl
There is also a much improved persistent script which involves a lot less forking,
and also a caching mechanism. If you would like to use this version (recommended),
add it to your snmpd.conf with the following instead :
pass_persist .1.3.6.1.3.1 /usr/bin/perl /usr/local/bin/iostat-persist.pl
Only use one of these - don't enable both!
Then restart your snmpd process. After the cron job has run (check for the
existence of the /tmp/iostat.cache file), you should be able to test the script
returns data, using a snmpwalk command similar to the following :
snmpwalk -v1 -c community_string your_host_ip .1.3.6.1.3.1.2
You should get a list of devices on the server returned, which will look similar
to the following on Linux :
SNMPv2-SMI::experimental.1.2.1 = STRING: "sda"
SNMPv2-SMI::experimental.1.2.2 = STRING: "dm-1"
SNMPv2-SMI::experimental.1.2.3 = STRING: "sdb"
SNMPv2-SMI::experimental.1.2.4 = STRING: "dm-2"
Or on Solaris :
SNMPv2-SMI::experimental.1.2.1 = STRING: "cmdk0"
SNMPv2-SMI::experimental.1.2.2 = STRING: "cmdk1"
SNMPv2-SMI::experimental.1.2.3 = STRING: "md0"
SNMPv2-SMI::experimental.1.2.4 = STRING: "md1"
If you get no output, go back and double check the previous two steps.
3.) CACTI INSTALLATION
For Linux, copy snmp_queries/linux/iostat.xml to your Cacti server, and place it
under <cacti_path>/resource/snmp_queries. Under Debian, this is
/usr/share/cacti/resource/snmp_queries , but may be different for other systems.
For Solaris, the process is the same, but the file in this archive is
snmp_queries/solaris/solaris-iostat.xml
If you've decided to change the OID, you'll also need to modify these files.
Next, log into your Cacti web interface, and click on "Import Templates". Import
all of the templates under the templates directory for your OS.
You should then be able to go to the host device you want to monitor, and add
the new data queries. Then, click on "Create Graphs for this Host", and
select the devices you want to graph.
FEEDBACK
--------
Any comments, criticism, bug reports, suggestions, fixes, etc. all appreciated!
Drop me a line at [email protected], and I'll do my best to reply
The opinions and views expressed on this website are my own and do not necessarily reflect the views of my employer, past or present.