
Centreon review
Updated:
Note : This page may contain outdated information and/or broken links; some of the formatting may be mangled due to the many different code-bases this site has been through in over 25 years; my opinions may have changed etc. etc.
One of my favourite interview questions I used to ask candidates was a variation of "Desert Island Discs" : Imagine you are going off to be a sysadmin on a desert island, with no internet access, and further imagine that the previous sysadmin was a total fascist with a minimalist install policy. We’re talking a bare-bones "classic" Solaris installation, or a minimal Debian system here. You’ve got SSH installed, but not much else. Before you hop on the boat, however, you are given a couple of hours high-speed internet access and a USB stick. You can take up to 5 tools with you to this desert island: What do you pick ?
It was always an interesting question to ask, because it gave you an insight into the kind of sysadmin tasks someone had been doing before, and it also served as a nice, relaxed "ice breaker" type question. For my money, aside from some tools like rsync and screen which I couldn’t live without, a decent monitoring package would have to be top of my priorities. There are a bunch out there: some of them free; some of them commercial, but the one that would make it on to my USB stick would have to be Nagios.
It’s open source, extremely well documented and widely implemented, and there are a ton of useful add-ons and plugins available for it. The only draw backs I can find with it are it’s ugly web interface, the complexity involved in setting up a new system for monitoring, and the disjoint between availability and performance monitoring. If you have money to throw at a problem, then software like Uptime or Hyperic neatly deal with all of these issues, but they can be quite pricey if you have a large number of systems to manage and a tight budget.
So, you can imagine my excitement when I first discovered Centreon. It’s essentially a monitoring platform that uses Nagios at it’s core. You could think of it as a fancy frontend to "stock" Nagios, but it’s so much more than that: besides the attractive interface, it also bridges the gap between availability and performance monitoring, and makes Nagios administration a snap. Due to the reliance on Nagios though, I’d go so far as to say that before you experiment with Centreon, you really should have set up "stock" Nagios, and be familiar with the plugin architecture, NRPE and how alerts / escalations are managed. Ideally, you should have a stock Nagios installation you can use to duplicate on Centreon/Nagios.
Installation is a bit of a mission, however. My original approach was
to try and use the Debian-provided packages of Nagios, NDO and other
prerequisites, and then install Centreon on top of that. After several
failed attempts of tweaking paths and settings, I gave up. It was just
far easier to follow the standard instructions and install everything
from source on a stock system. Much of the "official" documentation is
in French though, so it may be that there are some better instructions
for that sort of thing for our friends on the continent. It’s also
fairly loosely organised on the Wiki, so be prepared to put some time
aside beforehand to browse and collate all the documentation you’ll
need.
My test system was a Debian Lenny 32-bit system, running
as a Xen DomU with Apache 2.2, PHP 5, and MySQL 5.0. I kept the install
on a VM as I found that it’s best to keep the Centreon/Nagios system
separate from any other monitoring applications you may want to run,
particularly as it installs and manages it’s own PEAR modules etc.
Also, due to the somewhat involved installation process, you may find
you need a couple of attempts to get everything just right. This is
where being able to snapshot and rollback a VM is invaluable! One
suggestion for the Centreon developers: How about providing a
pre-configured VM appliance download ? It would drastically lower the
barrier for people interested in just trying the application if they
could simply import a disk file, click and go.
Despite the
long-winded installation procedure, I found that subsequent upgrades to
be smooth and trouble free. During the time I have been running
Centreon, there have been 5 or 6 "point" releases, and one major jump
from 2.0.x to 2.1.x. Each of these passed without any incident - a
simple upgrade install from the terminal (pointing the installer at
your configuration files), finished off with a web-based database
upgrade wizard. These wizards, and indeed, the rest of the interface
are all extremely well designed and easy to follow; Don’t let the
"quirky" English on the main site and wiki put you off if, like me,
your French doesn’t go much beyond "Bonjour!" and "Je m’appelle…"
When you first log in, you’ll see a dashboard view that looks similar to this :
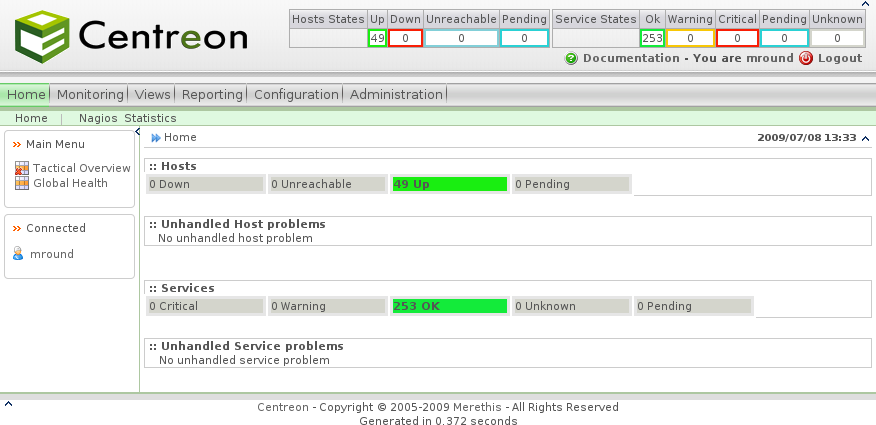
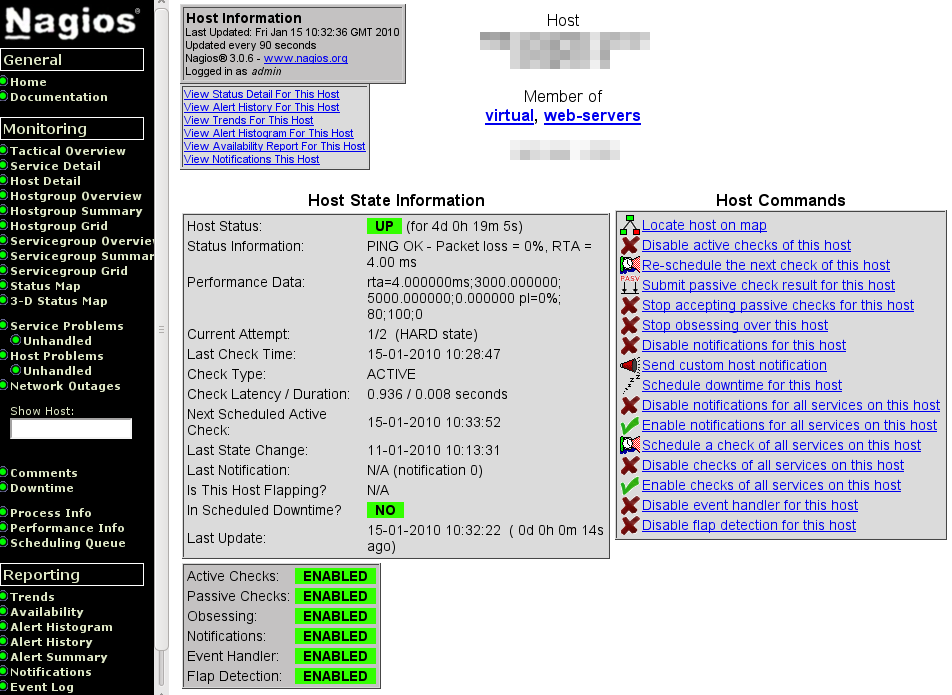
This provides an overview of your network, and reports on any issues found. A smaller, less-detailed version of this information is also always present at the top right of the screen. The visual improvements over the standard Nagios interface should already be readily apparent. As you’ll see throughout the rest of the snapshots, the clean lines and functional design are carried throughout the whole interface: Just as a further example, here’s the Nagios host detail screen :
And here’s the Centreon page showing the detail for the same host :
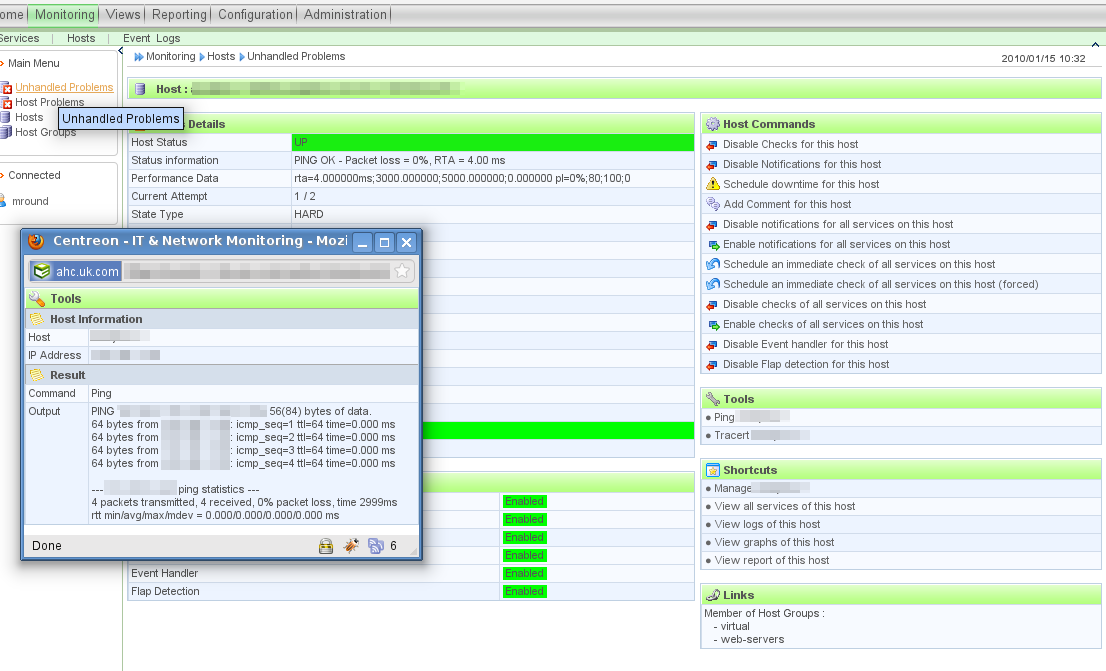
As
well as illustrating the aesthetic and functional improvements in the
Centreon interface, it also highlights the fact that you can continue
to use the Nagios interface and tools alongside it.
The first
thing you’ll want to do is to define your hosts and services. Although
you should be able to import an existing configuration, you’re almost
certainly better off generating a new configuration from scratch, and
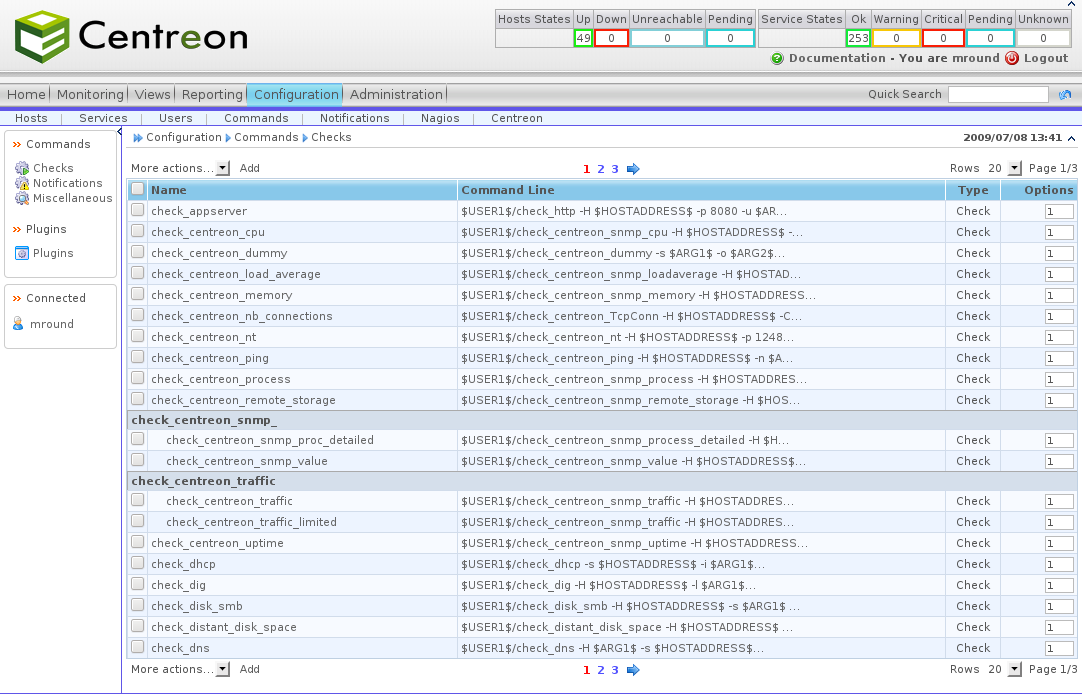
far less likely to run into problems. If you’re familiar with
configuring Nagios, this is where you’ll start to see the immediate
benefits. Normally, you’d have to configure your various check commands
by editing a config file, which usually involves (at lest for me) an
editor, a couple of terminal windows open and the output from the check
command’s help file to work out what all the switches do. Now, all this
is managed by a neat GUI :
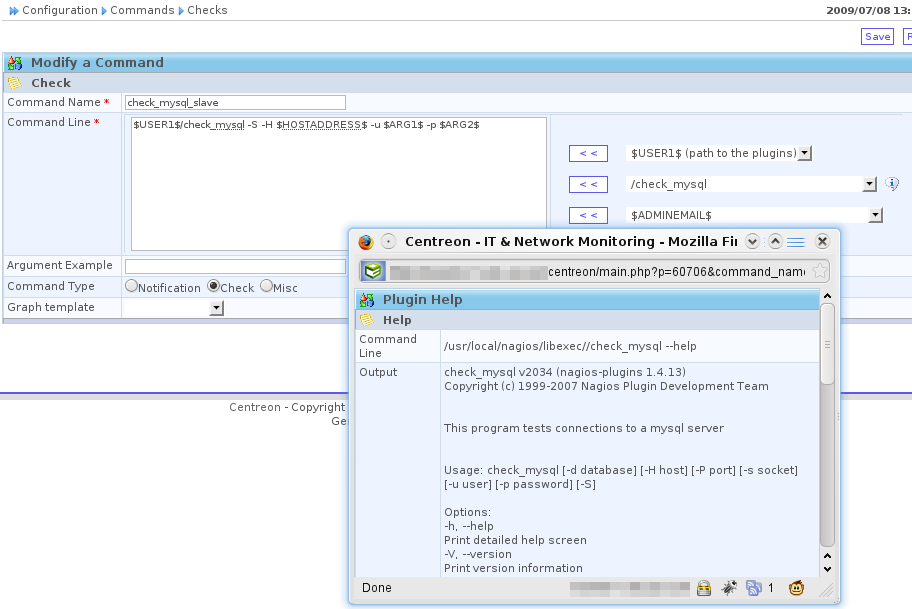
And
here’s the editor dialog that assists you in creating your command
definition - note the popup with the check command output displayed!
After setting up your escalation groups, contacts and templates, you can then easily create new hosts, and assign them to groups, pull in templates, and tweak settings through the GUI:
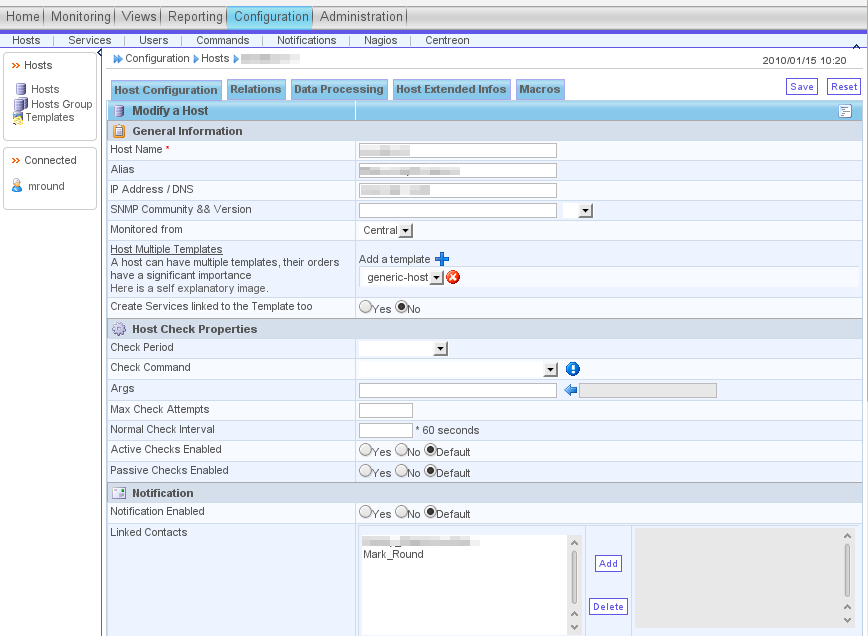
An
interesting item here is the "Monitored from" drop-down; Centreon has
extensive support for distributed monitoring, which allows you
to utilise a central monitoring server, and satellite nodes at
different sites.
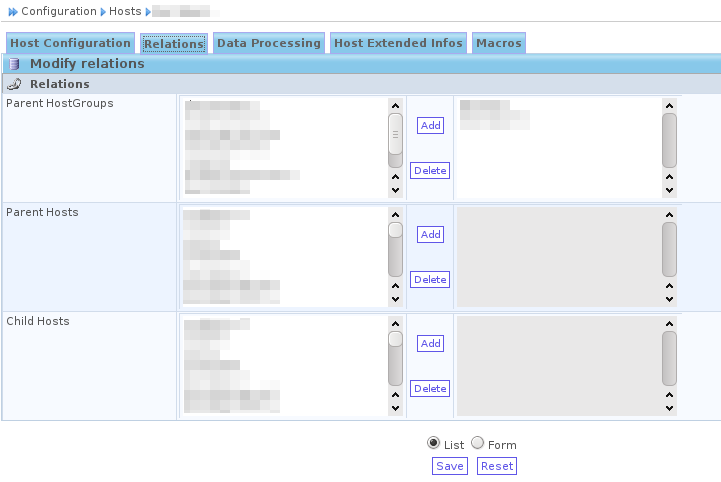
Where the web interface shines is when you are
setting up relationships, or assigning contacts to a host. Instead of
manually editing the configuration files (and then kicking yourself
when Nagios won’t restart because you’ve referenced a non-existant
service or host in a group somewhere), you can simply assign or remove
items using a familiar list tool in the GUI :
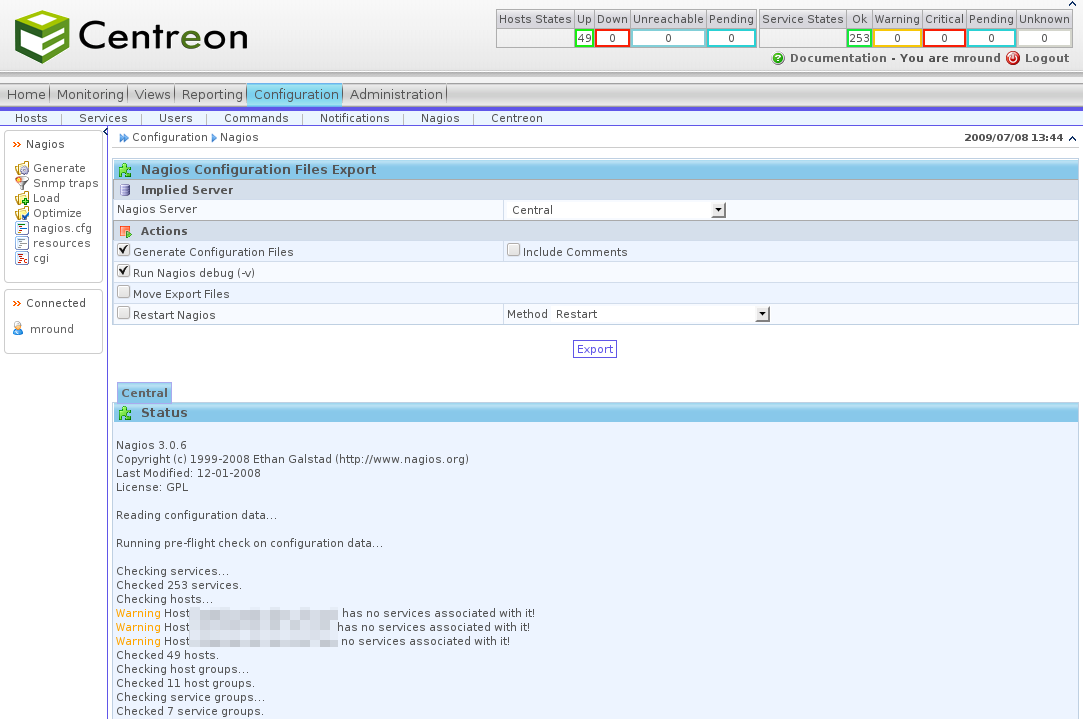
Of course, as it’s all ultimately using the text-based configuration files, you can always use your existing scripting or configuration management infrastructure to manage hosts, services and relationships as needed. After you have made your configuration changes, they are not immediately picked up by Nagios; you need to export the generated configuration which is done by navigating to the Configuration -> Nagios screen. By default, this will only test the configuration; once you’re happy with it, you can tick the "Move Export Files" and "Restart Nagios" boxes to make the generated configuration live and restart the Nagios process.
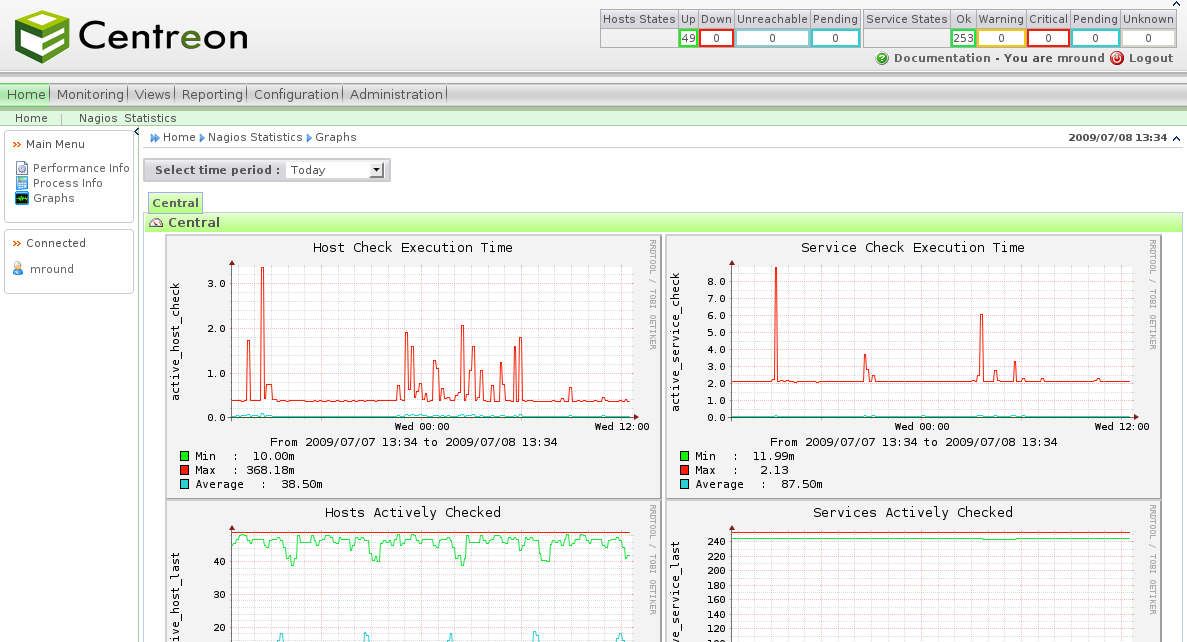
Once everything is defined and being monitored, you will notice that quite a lot of information is available in a graphical form, right out of the box. For example, the home tab provides a link to a Nagios Statistics page which displays some graphs showing the performance of the Nagios engine, hosts monitored and other details :
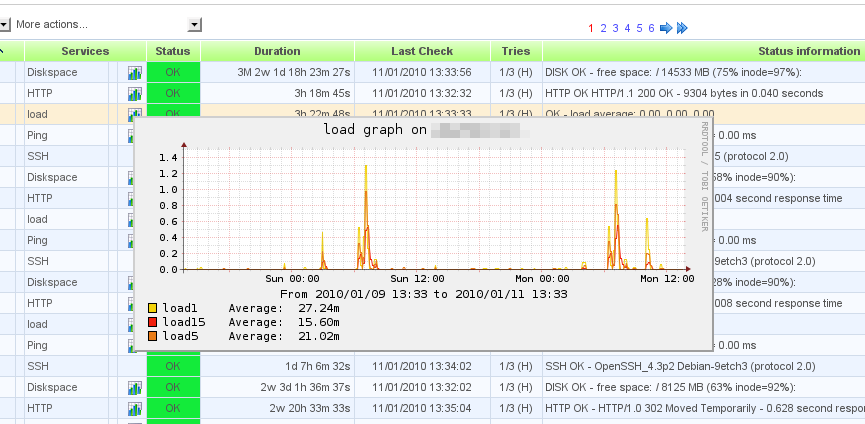
If you go to the Monitoring->Services screen, you’ll find that some of the pre-defined services have a graph icon next to them. Hovering over them reveals the data plotted graphically - for example, load average:
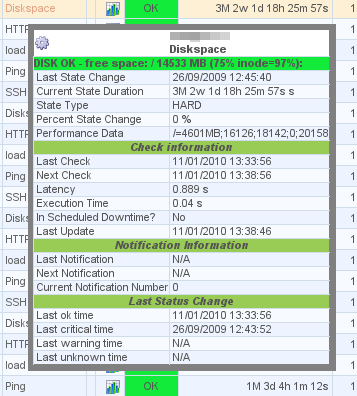
Another nice touch is the popup service detail, which is displayed when you hover the mouse over the service name :
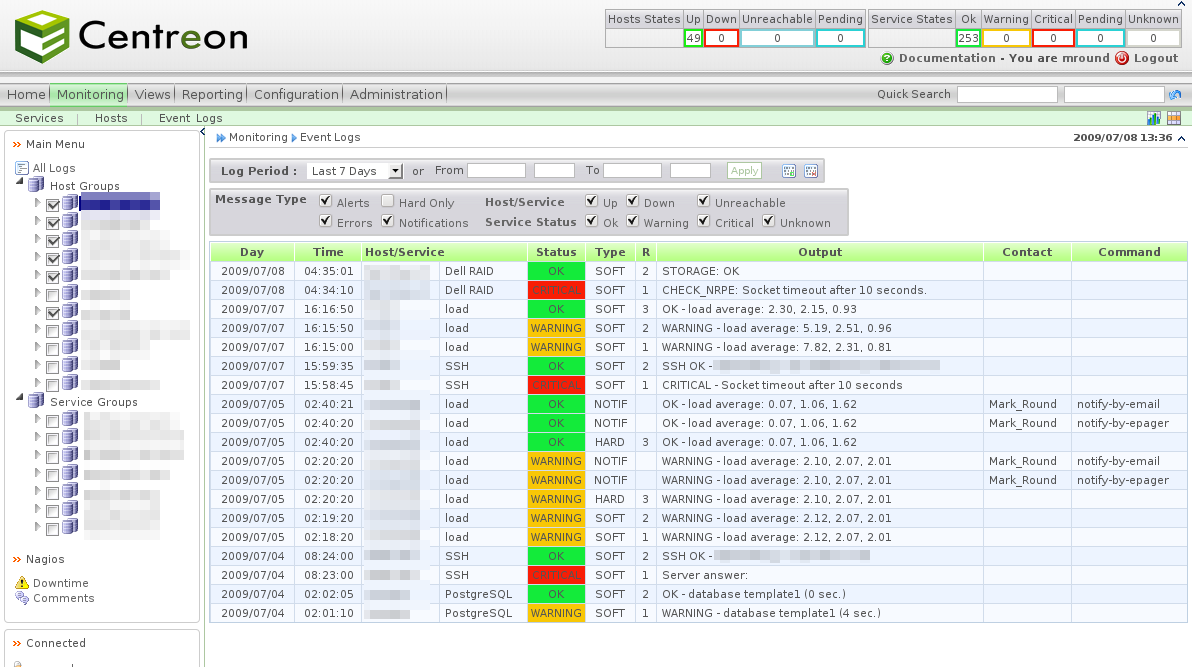
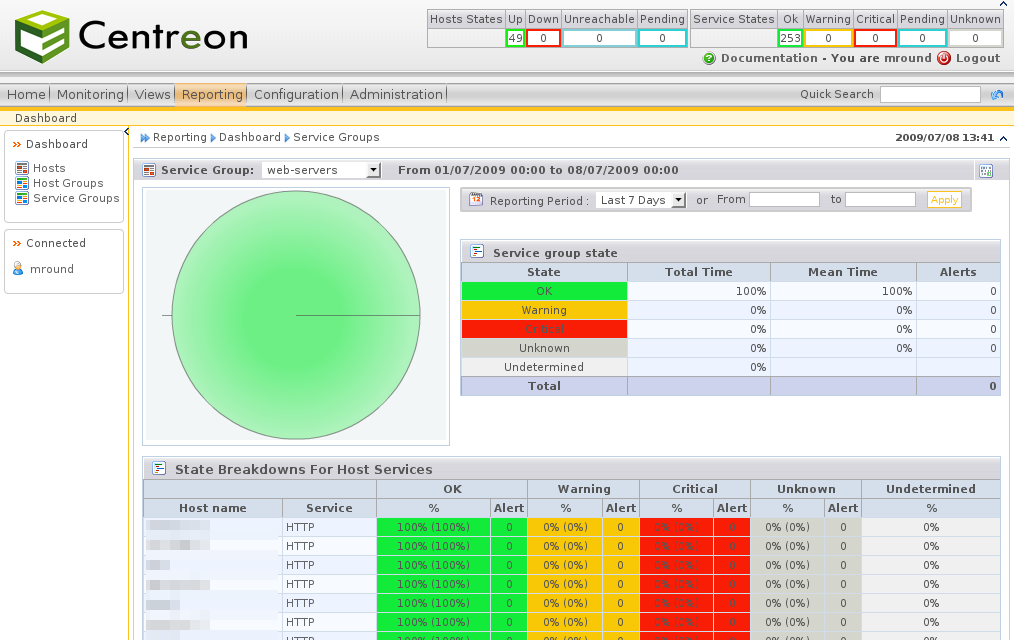
There’s also extensive reporting available :
All in all, I am extremely impressed with Centreon. There are plenty of monitoring tools out there that compete with it (ZenOSS, Zabbix), but nothing that comes close if you already have an investment in Nagios.
The opinions and views expressed on this website are my own and do not necessarily reflect the views of my employer, past or present.